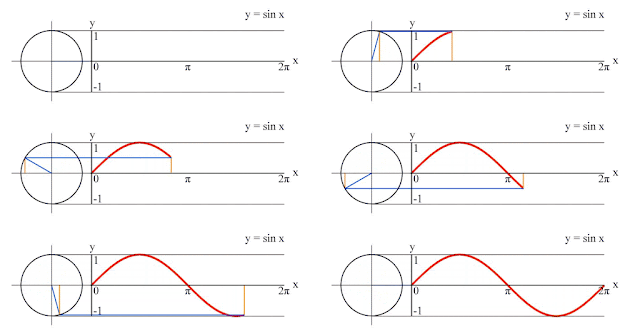
Lets take a look at the graph of

The period (or wavelength) of a a sine curve is the how long it takes to complete one cycle of the graph. In the case of a sine curve the period is
 . The amplitude of a sine graph is the distance from the crest (or the maximum value) or the trough (the minimum value) to the mid line. The amplitude of a normal sine curve is 1. The range of this sine curve is [-1, 1].
Now lets take a look at the graph of

Just like in the sine curve the period of this graph is  . The amplitude, also like the sine graph, is 1. The range of this graph is also [-1,1]. As you can see there are many similarities between the sine and cosine curves. In fact, the cosine curve can be seen as the sine graph shifted to the left
  . Speaking of graphs getting shifted, lets take a look at transformations of sine and cosine graphs.
 . The amplitude, also like the sine graph, is 1. The range of this graph is also [-1,1]. As you can see there are many similarities between the sine and cosine curves. In fact, the cosine curve can be seen as the sine graph shifted to the left
  . Speaking of graphs getting shifted, lets take a look at transformations of sine and cosine graphs.
Transformations of a sine (or cosine graph)
The basic equation looks like this:
a= vertical stretch or a change in amplitude
A change in amplitude has no affect of the period
If a is negative then the graph is reflected in the x-axis
b= horizontal compression or stretch
In other words b changes the period
A change in b has no affect on the amplitude
If b<0 then the graph is reflected in the y-axis (which looks like a reflection in the x-axis)
c= a phase shift or a shift left or right
d= a vertical shift
This is a shift of the mid line
Here is a link to a quick animation and interactive sine/cosine graph: Sine and Cosine Transformation Animation
Sine curves and Cosine curves are related to the unit circle. One period is also one rotation around the unit circle, which is also  . The x-values are the angles of the unit circle and the y-values are the corresponding value (whether it is cosine or sine) to that angle. The range of a normal sine graph and cosine graph is [-1,1] because on the unit circle, sine and cosine values never exceed 1 or drop below -1.
 . The x-values are the angles of the unit circle and the y-values are the corresponding value (whether it is cosine or sine) to that angle. The range of a normal sine graph and cosine graph is [-1,1] because on the unit circle, sine and cosine values never exceed 1 or drop below -1.


No comments:
Post a Comment