Friday, March 4, 2016

4.7 Inverse Trigonometric Functions

Inverse Sine Function

In order for a function to have an inverse it must be One-to-one and pass the Horizontal Line Test. It is obvious that the graph  does not pass this test. So it may appear illogical to use inverse trigonometric functions, but they help make equations much easier. Below is each Trigonometric Function Graph and its Inverse.


The inverse sine function is defined by

if and only if  


where  and 

*Domain of   is 

*Range of   is 

* Notice the domain and range are reversed on the interval of the graph y = sin x above*

Remember when evaluating for inverse sine functions it the arcsin of x represents an angle measure


Therefore,  


Other Inverse Trigonometric Functions

a. if and only if   

      Domain                                                                       Range            


b. if and only if 

      Domain                                                       Range

All Real Numbers                               


Evaluating Inverse Trigonometric Functions

1. 


Therefore,  


2. 


Therefore, 

Using a Calculator to Approximate Inverse Trigonometric Functions

* Make sure your calculator is in radians otherwise you will not find the correct answer

1.  

Calculator Keystrokes   

From the display, it follows that 

Compositions of Functions

a. If   and  are both true,

and  are true.


b. If  and  are both true,

and  are true.


c. If x is a real number and  are both true,

and  are true.

These compositions follow the same rules learned earlier when finding the composites of functions and allow us to use these trigonometry functions as identities. It is important to note that any value outside of either interval makes these identities false, thus it is important to stay within the boundaries of the intervals.

Using Inverse Properties

1.   because  is contained within, the inverse property holds, and  


For Extra Help

https://www.youtube.com/watch?v=JGU74wbZMLg - Arcsin


https://www.youtube.com/watch?v=eTDaJ4ebK28 - Arccos


https://www.youtube.com/watch?v=Idxeo49szW0 - Arctan

These links will direct you to video explanations from Khan Academy that should help you further understand Inverse Trigonometric Functions.



Wednesday, March 2, 2016

4.5 Graphs of Sine and Cosine Functions

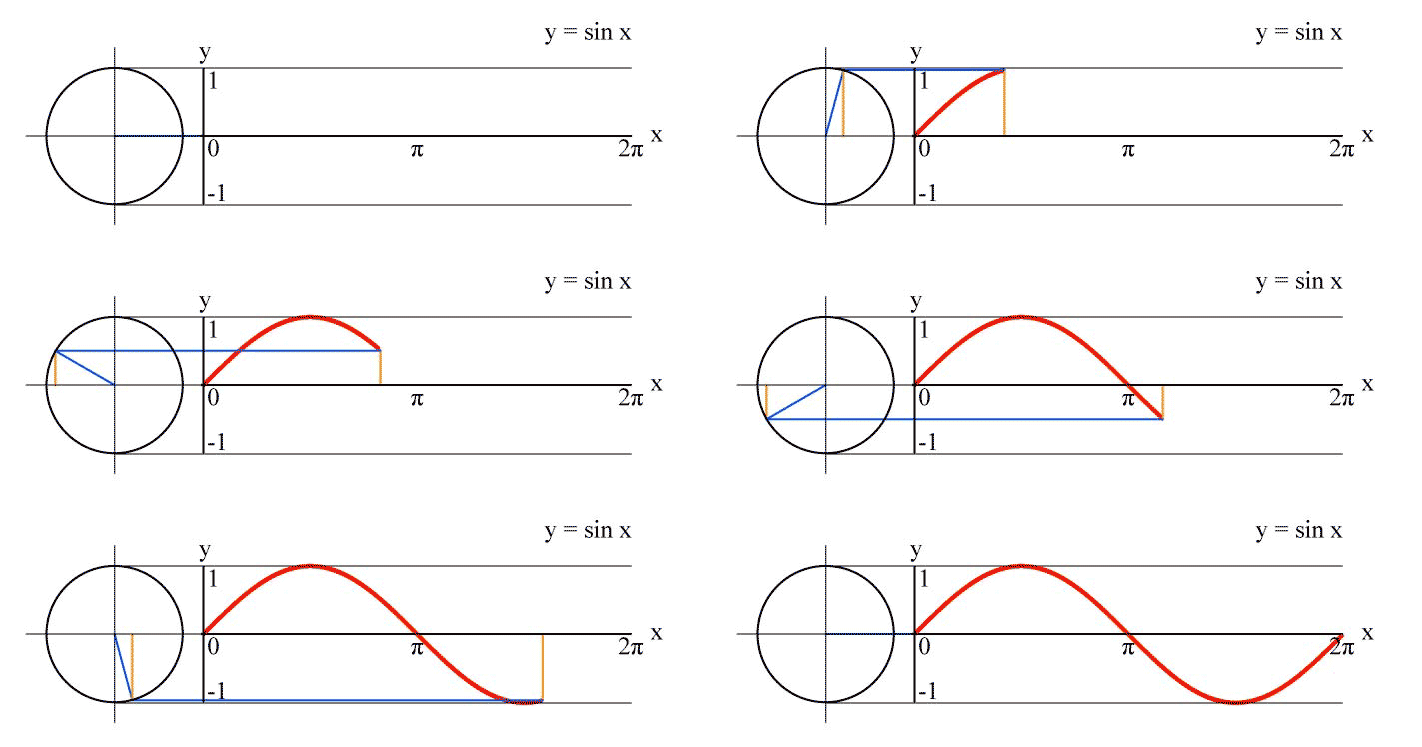
The graph of a sine function is called a sine curve. Likewise the graph of a cosine function is called a cosine curve.

Lets take a look at the graph of 

The period (or wavelength) of a a sine curve is the how long it takes to complete one cycle of the graph. In the case of a sine curve the period is . The amplitude of a sine graph is the distance from the crest (or the maximum value) or the trough (the minimum value) to the mid line. The amplitude of a normal sine curve is 1. The range of this sine curve is [-1, 1].

Now lets take a look at the graph of 


Just like in the sine curve the period of this graph is . The amplitude, also like the sine graph, is 1. The range of this graph is also [-1,1]. As you can see there are many similarities between the sine and cosine curves. In fact, the cosine curve can be seen as the sine graph shifted to the left . Speaking of graphs getting shifted, lets take a look at transformations of sine and cosine graphs.

Transformations of a sine (or cosine graph)

The basic equation looks like this:

a= vertical stretch or a change in amplitude
      The amplitude of a function can be calculated by taking the absolute value of a -> 
      A change in amplitude has no affect of the period
      If a is negative then the graph is reflected in the x-axis

b= horizontal compression or stretch 
      In other words b changes the period
      A change in b has no affect on the amplitude
      The new period can be calculated then by plugging b into 
      If b<0 then the graph is reflected in the y-axis (which looks like a reflection in the x-axis)

c= a phase shift or a shift left or right
      As stated before the cosine graph can be seen as the sine graph shifted 

d= a vertical shift
     This is a shift of the mid line

Here is a link to a quick animation and interactive sine/cosine graph: Sine and Cosine Transformation Animation 

Sine curves and Cosine curves are related to the unit circle. One period is also one rotation around the unit circle, which is also . The x-values are the angles of the unit circle and the y-values are the corresponding value (whether it is cosine or sine) to that angle. The range of a normal sine graph and cosine graph is [-1,1] because on the unit circle, sine and cosine  values never exceed 1 or drop below -1. 


4.3 Right Triangle Trigonometry

Basic Trig & Trigonometric Identities 

Some basic trigonometric functions are sin, cos, and tan. As well their inverse functions are csc, sec, and cot.

To understand how to find these trig functions on a triangle SOH CAH TOA is an easy phrase to remember.
Meaning:


A trigonometric identity, are equations that are true for all variables of right angled triangles. It is the proving of an identity or function, so that both sides of the equation are true for each other.

Reciprocal Identities are trigonometric identities of sec, csc, and cot, that are represented in terms of sin, cos, and tan.


A quotient identity deals with tan and cot functions and their relationships with cos and sin.

Even or Odd Trig Identities 
As shown above only cos and sec functions are even, leaving csc, sin, tan, and cot all as odd functions. 

Next are the three main Pythagorean Identities: 
They can all be transformed into other identities through the simple use of the addition and subtraction  property. 
The first identity that is stared in yellow is the main identity. Both of the bottom two identities have been derived from the first identity. This is shown below: 

When applying these skills to solving identities, there is no one specific way to solve the problem. As either side of the equation can be worked, and the pythagorean identities can be used differently. 

Examples: